|
Upcoming Deadlines in January
January 7 - 31st Reenrollment for Current Students and Sibling Enrollment (of current students) January 10 Volunteer Credits Due per Family
0 Comments
December 3
6th Grade Field Trip to the Alliance Theater to see "A Christmas Carol" December 6 Brighten Blizzard 6:00 - 8:00 pm December 6 through December 13 Book Fair December 7 Volunteer Work Day 9:00 - 12:00 pm December 9 PTO Meeting 5:00 pm Board Work Session 6:00 pm December 13 7 Cs Deck—7 Activities Due (for participation in the Green Party in January) December 16 Board Meeting 6:00 pm December 19 Middle School Reward Day December 20 Half Day - Dismissal at 11:30 am End of Second 9 Weeks December 23 through January 6 Winter Holiday - NO SCHOOL :-) January 7 Students Return to School January 8 Report Cards Issued January 9 7 Cs Green Party Thursday and Friday we will explore factors that influence economic growth in countries. Students will explore the Gross Domestic Product and why it is important.
To access the interactive diagram of the GDP below, once you get to the web page, click "GDP DIAGRAM" to the right in the article box.
SS6E3. The student will describe factors that influence economic growth and examine their presence or absence in Latin America.
Four Types of Economic Growth There are three kinds of resources: human resources, capital goods, and natural resources. It is very important for the human resources of a company or country to have a high human capital. These resources help to make goods and services, which increases a country's GDP. An entrepreneur is a person that takes a risk to start a new business or put a new idea to use. Human Capital: the technical knowledge and skills that a laborer (human resource) has. Some companies and countries invest in more education and training for their workers. Health care is also important, and some companies or countries provide health care, usually at a fee, for the worker. People who do not have access to education or health care can be put at a disadvantage when they apply for jobs. Lowering the unemployment rate improves the living conditions for all people in a country. Capital Goods: resources that are human-made materials used to create a product. Examples of capital goods include factories, machinery, tools, and new technology. Capital goods can help increase production for a business or country. Natural Resources: resources that are supplied by nature, such as land, air, water, minerals, and time. Companies that learn to work with the surrounding natural resources, like air and water, are better for the environment. Companies that learn to manage time well can be more productive in the long run. Entrepreneur: a person who organizes the use of resources to produce goods or services. He or she thinks of new ideas and is willing to take risks to start a business. Entrepreneurs are decision-makers, and most are interesting in making a profit. Gross Domestic Product (GDP): the total market value of goods and services produced in a certain country during a specific period of time. Investment in human capital and capital goods can help a country's GDP. As we continue to explore economic topics, I will list each standard separately with extra resources to study at home. We will not have social studies class on Monday (PC gone and focusing on math) or Tuesday (field trip). Monday night's homework is below - DUE WEDNESDAY - informational reading about NAFTA with some essay questions to answer. Please encourage your student to answer COMPLETELY in COMPLETE SENTENCES. :-)
On Wednesday, we will explore the economic systems more closely with the PPT listed below. Students will fill out a graphic organizer during the lesson. This will be very important as students will use the graphic organizer as a resource to complete Wednesday night's homework - design a 3-page booklet/foldable about these economic systems - command, traditional, and market. This will be due on Friday.
SS6E1. The student will analyze different economic systems.
Characteristics of economic systems Free Market Private ownership of property/resources Business decisions are driven by the desire to earn a profit There is a great deal of competition Consumers have many choices https://www.youtube.com/watch?v=FNE_LOURzBk#t=38 (1:16) Command Economy Central ownership of property/resources Centrally planned economy Lack of consumer choice Example: Cuba https://www.youtube.com/watch?v=2ykezA1hs4w (0:33) Traditional Economy Allocation of resources is based on rituals, habits, or customs Roles are defined by family People work together for the common good Little individual choice https://www.youtube.com/watch?v=ow9PKkq6-SU Mixed Economy Individuals and businesses as decision makers for the private sector Government as decision maker for the public sector A greater government role than in a free market economy Most common economic system today Examples: Canada, Brazil, the United States Every economic system must answer three important questions: what to produce, how to produce, and for whom to produce. What to produce? This question asks what people will make and sell. Many countries produce goods or services based on which resources are available and which will make the most money for the lowest cost. A country's type of economy usually has less influence on this question than it does on the other questions. How to produce? This question asks how people will make a good or service. Manufacturing is a way to produce. Sometimes production is outsourced, or sent to other countries, in order to keep cost down. Downsizing reduces the number of employees, also allowing cost to be kept down. For whom to produce? This question asks whom goods are services will be made for. People in market economies will produce for a target market. This will allow them to make the greatest profit. On Monday, each student will complete 2 practice/reteach activities for a standard from our NS(Number System) unit that the student did not pass the first time around. Once the student finishes one center and checks it, I will offer the student the opportunity to retest on that standard. The student's report card will be updated to reflect the mastering of the standards assessed. Those who have passed all of the NS standards, will work on problem solving cards. Homework given Monday night (review of Statistics standards taught so far) is due on Wednesday as our classes will be on a field trip next Tuesday, December 3. We will not have a structured math lesson on that day. Wednesday gets us back on schedule and into a new topic: Interquartile Range. Quartiles: the points that divide a data set into roughly four equally-sized parts Interquartile Range (IQR): the difference between the third and first quartiles in a data set. •Upper quartile (Q3) – lower quartile (Q1) = IQR The previous lesson in this cluster of lessons covered range as a measure of variation. This lesson will build on students’ understanding of range to explore the interquartile range as a measure of spread or variation. At the end of this lesson, students should be able to break a set of data into quartiles to find the interquartile range. They should understand why and how the interquartile range is useful, particularly when the range is not. An understanding of both range and interquartile range will lay the groundwork for future lessons on how to create and analyze box plots. This lesson is one of a group of lessons designed to show that sets of data generated by statistical questions can be analyzed by looking at the spread of the data. In Grade 6 students see that the data collected in response to a statistical question have certain attributes (center, spread, overall shape).
The end of the week (Thursday and Friday) involves creating and drawing conclusions about BOX PLOTS. This is most likely the first time that students at the sixth grade level will see box plots. While it is a new concept, students do come into the lesson with prior knowledge that will help them to create and analyze box plots. In the previous two lessons, students learned about the range and interquartile range. Through these lessons, students built an understanding of maximum, minimum, Q1 and Q3. Throughout the unit students have also been learning about the median. These are the five components of the five-number summary that is required to create a box plot. Knowing these five vocabulary words will serve very useful as students learn about box plots. Going forward, students will continue to work with box plots as they use them to compare multiple sets of data. It is important that students have a firm grasp on box plots by the end of this lesson, as the next lesson requires students to create double box plots. Lesson 6 vocabulary: Box Plot: A graph that uses a rectangle to represent the middle 50% of a set of data and “whiskers” at both ends to represent the remainder of the data. Five-Number Summary: Minimum Lower Quartile (Q1) Median Upper Quartile (Q3) Maximum
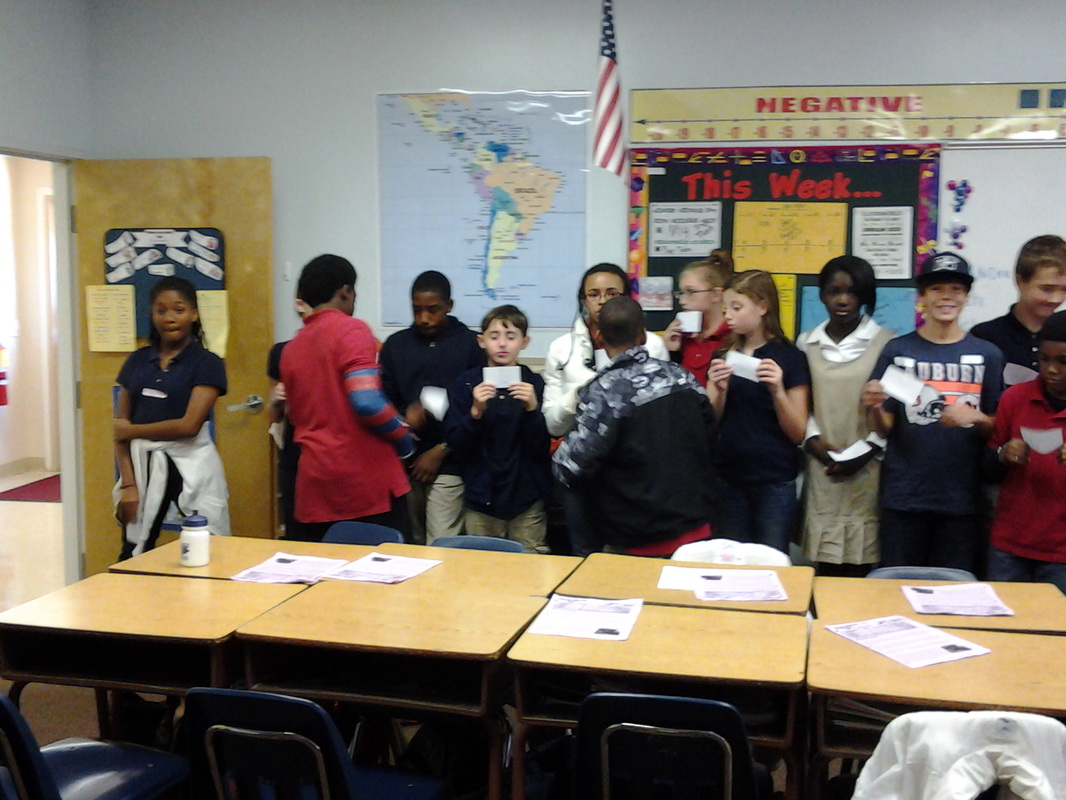 Without being able to speak, students arrange themselves from the lowest value to the highest... 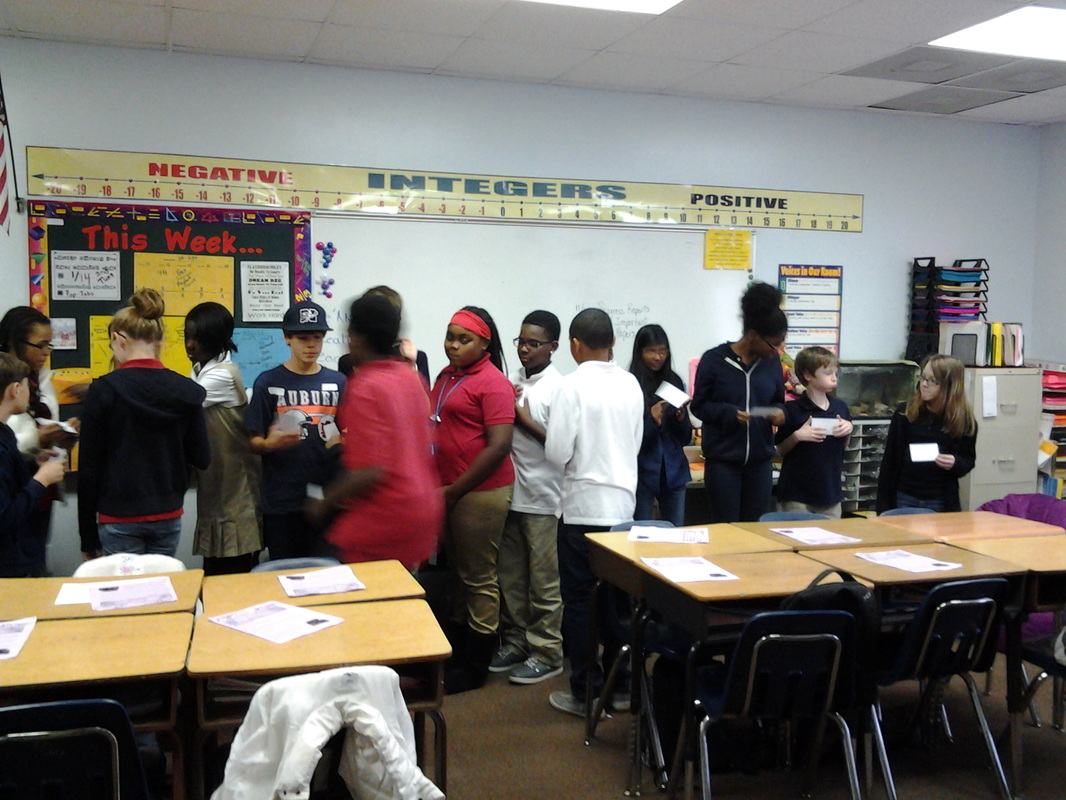 Only the data on their card (the number of letters in their first name) can speak for them.... The statistics unit began with an introduction to statistical questions. From there, the mean and median are introduced as measures of center that can be used to summarize a set of data gathered in response to a statistical question. Spread is introduced as a measure to describe the variability of a set of data gathered in response to a statistical question. By the end of the unit, students should recognize the differences between measures of center and measures of variation and also what they are useful for despite the fact that both are used to describe data sets. The overarching goal is for students to see that the data collected in response to a statistical question have certain attributes (center, spread, overall shape). This week's PPTs:
Information sheets:
This week we will dig into NAFTA, discussing its pros and cons. SS6E2 The student will give examples of how voluntary trade benefits buyers and sellers in Latin America and the Caribbean. a. Explain how specialization encourages trade between countries. Specialization encourages trade and can be a positive factor in a country’s economy. Specialization occurs when one nation can produce a good or service at a lower opportunity cost than another nation. Students should be able to discuss how this has helped countries in Latin America and the Caribbean. It is not necessary that students know specific nations for the CRCT, as questions will be of a broad nature. Students should also note where specialization has not functioned as expected. What are the potential problems of over-specialization, such as one- crop economies and lack of diversification? How can this impact a region’s economy? b. Compare and contrast different types of trade barriers, such as tariffs, quotas, and embargos. Students should be able to describe each of the listed trade barriers and apply them to Latin America and the Caribbean. Questions will not require students to associate trade barriers with specific countries but to explain an example provided in an assessment question. Students should be able to explain the reasons a specific trade barrier would be used and how that trade barrier would affect each country involved. c. Explain the functions of the North American Free Trade Agreement (NAFTA). Students should have a basic understanding about why NAFTA was formed. Explain the functions of NAFTA, which countries are involved, and the meaning of free trade. Understand key terminology, such as tariffs, quotas, imports, and exports. Have a basic understanding of the advantages and disadvantages of NAFTA. d. Explain why international trade requires a system for exchanging currencies between nations. Students should be able to explain the reasons why currency exchange systems facilitate international trade. Students should be able to identify examples, from Latin America and the Caribbean, on how international trade between these countries and other countries of the world has benefited from a system for the exchange of currency. Students do not need to know types of currency or how to calculate exchange rates. It is sufficient for them to know that exchange rates provide a procedure for determining the value of one country’s currency in terms of another country’s currency. They should also understand that without a system for exchanging currencies it would be very difficult to conduct international trade.
As we study the economy of Latin America countries, this is our first standard: SS6E1 The student will analyze different economic systems. The goal of this standard is to acquaint students with the three major types of economic systems. The second element helps students understand how every country’s economy is a blend of command and market economies. Students are then asked to compare specific economies within the region under study. a. Compare how traditional, command, and market economies answer the economic questions of (1) what to produce, (2) how to produce, and (3) for whom to produce. Students should understand the basic characteristics of each of the three types of economic systems in relation to how they answer the 3 questions of economics. Focus should be on the command and market economies. This should not be a major lesson in economics. Students should understand in the broad sense how each economy functions to answer (1) what to produce, (2) how to produce, and (3) for whom to produce. b. Explain how most countries have a mixed economy located on a continuum between pure market and pure command. Since no country has a pure command or pure market economic system, most economies combine aspects of both of these pure economic systems albeit to different degrees. Students should understand how real economies fall somewhere between the two extremes. This is not an in-depth study of economic principles. This should be combined with element "a" in instruction. c. Compare and contrast the basic types of economic systems found in Canada, Cuba, and Brazil. Using the information learned in elements "a" and "b" students should compare how the economies in each listed country answer the basic questions of economics from element "a." They should also be able to explain from their answers the basic questions of economics and approximately where on the continuum between pure market and pure command each economy falls. They should also be able to explain why the country is in that position on the continuum. This is the PPT we started today. The questions at the end are excellent to review.
Our next unit is entitled Statistics. Grades 4 and 5 provided students with an opportunity to do the pre-work necessary to understand the concepts of statistics. However, statistics, in general, are not formally introduced until grade 6. Therefore, the concepts covered in this unit may be new to students. We will begin by understanding what a statistical question is. Then, students will be introduced to various ways to analyze the data collected by asking a statistical question. Throughout this unit, students learn that data can be analyzed using center, spread, and shape. The first cluster of lessons in the unit looks at measures of center as ways to describe a data distribution. By the end of this week, students should be able to describe a set of data using the median, mean, and range. They should also be able to determine which measure of center is appropriate to use to describe a particular set of data. Ultimately students should be able to use measures of center and measures of variation to describe data distributions. The idea of choosing median vs. mean is relevant in the real world. Often times home prices are reported in the context of the median home price. Salaries for sports players might also be expressed in relation to the median salary. Grades, on the other hand, and sports statistics, are often reported using the mean. Students should understand the difference between the two measures of center to understand given statistics and also to become more informed consumers. KEY STANDARDS Apply and extend previous understandings of measurement and interpreting data. MCC6.SP.1. Recognize a statistical question as one that anticipates variability in the data related to the question and accounts for it in the answers. For example, “How old am I?” is not a statistical question, but “How old are the students in my school?” is a statistical question because one anticipates variability in students’ ages. MCC6.SP.2.Understand that a set of data collected to answer a statistical question has a distribution which can be described by its center, spread, and overall shape. MCC6.SP.3 Recognize that a measure of center for a numerical data set summarizes all of its values with a single number, while a measure of variation describes how its values vary with a single number. MCC6.SP.4.Display numerical data in plots on a number line, including dot plots, histograms, and box plots. MCC6.SP.5.Summarize numerical data sets in relation to their context, such as by: MCC6.SP.5.a. Reporting the number of observations. MCC6.SP.5.b.Describing the nature of the attribute under investigation, including how it was measured and its units of measurement. MCC6.SP.5.c.Giving quantitative measures of center (median and/or mean) and variability (interquartile range and/or mean absolute deviation), as well as describing any overall pattern and any striking deviations from the overall pattern with reference to the context in which the data were gathered. MCC6.SP.5.d.Relating the choice of measures of center and variability to the shape of the data distribution and the context in which the data were gathered. The purpose of this unit is to begin the study of statistics, beginning with examples of one variable (numerical) data sets, and evaluating the mean and median of these data sets. These are all ways of describing a data set numerically. Students should become aware of different methods of organizing data, beginning with frequency tables which will then lead into histograms. Students will look at the similarity between the shape of the histogram and the shape of the dot plot for the same data set. Students will set the frequency table intervals (histogram intervals) so that a skyscraper or pancake effect does not occur. Students will mark the mean and the median on the histograms so that they understand that both of these values describe the center of the data. Students should begin to use statistical language, such a “distribution” to describe the histogram of the data. Students should also get into the habit of describing the shape of the distribution as “single peaked, double peaked, roughly symmetric, or skewed.” Next, students will find the range and Mean Absolute Deviation (MAD) of the data sets. This will require a strong conceptual foundation as to what these terms represent and the use of mathematical operations, such as addition and division. Students will use whole numbers to evaluate the MAD. The range and the MAD help describe the spread of the data, which describes data sets in more detail than just using measures of center. Students will understand the importance of knowing this measure of spread, instead of only using the mean or median when describing a data set. Students will also learn about box plots (often called box and whisker plots). Box plots are a visual display of the 5 Number Summary: minimum, lower quartile Q1, median Q2, upper quartile Q3, and maximum. It should be emphasized that the “box” holds the middle 50% of the data, known as the Inter Quartile Range (IQR). Is it better to use the mean or the median. This may sound like an obscure technical question, but it really can matter. The short answer is "it depends" - to know which you should use, you must know how your data is distributed. The mean is the one to use with symmetrically distributed data; otherwise, use the median. MISCONCEPTIONS ***Students may believe all graphical displays are symmetrical. Exposing students to graphs of various shapes will show this to be false. ***Mode is remembered as the “most” and often students think this means the largest value, not “most frequent”. ***Students do not remember to put the numbers in order before finding median. ***Students assume that mean is always the best way to describe a set of data. ***Students needs to understand that mean is a redistribution of the data where mode and median are not. **Students may think that when data is “skewed to the left” that most of the data is on the left. In fact, the tail of the data is on the left and most of the data is on the right. Students confuse clustering and skewing. Here are some web sources that students can use to practice at home also! http://www.ixl.com/math/grade-6/calculate-mean-median-mode-and-range Calculate mean, median, mode, and range http://www.ixl.com/math/grade-6/interpret-charts-to-find-mean-median-mode-and-range Interpret charts to find mean, median, mode, and range http://www.ixl.com/math/grade-6/mean-median-mode-and-range-find-the-missing-number Mean, median, mode, and range: find the missing number http://www.ixl.com/math/grade-6/identify-representative-random-and-biased-samples Identify representative, random, and biased samples http://www.mathsisfun.com/data/index.html ***************************************************************************************** The following are our first three lessons, homework, and information that will be given out to go in your child's math binder. We will go through binders on Monday and make sure that all important information needed to close out Unit 2 is in their binder.
|
Mrs. Beck's Math and Social Studies ClassesCategoriesArchives
April 2015
Categories |
||||||||||||||||||||||||||||||||||||||||||||||||||||||||||||||||
 RSS Feed
