|
January
10 Volunteer Credit Hours Due Per Family January 6 NO SCHOOL January 7 – 31 Reenrollment for Current Students and Sibling Enrollment (of current students) January 7 Students Return to School January 8 Report Cards Issued January 9 7 C’s Green Party After School Parent Information Meeting 6:30 pm January 13 PTO Board Meeting 5 pm Gov. Board Work Session 6 pm Staff Luncheon – 3rd grade parents January 16 EL Parent Workshop 6 – 8 pm January 17 Reading Bowl Competition – Picture Books 5:30 pm AHS January 18 Reading Bowl Competition – Picture Books 8:30 pm AHS January 20 NO SCHOOL January 22 8th Grade Writing Assessment January 27 Governing Board Meeting 6 pm January 31 Half-Day - 11:30 Dismissal February 1 – 15 Open Enrollment. See the website for details.
0 Comments
The following website has excellent activities to practice before, during and after our next math unit.
http://www.thinkingblocks.com/ThinkingBlocks_Ratios/TB_Ratio_Main.html 6.RP.A.1 – Understand the concept of a ratio and use ratio language to describe a ratio relationship between two quantities. For example, "The ratio of wings to beaks in the bird house at the zoo was 2:1, because for every 2 wings there was 1 beak." For every vote candidate A received, candidate C received nearly three votes." Learning Targets: I can write ratio notation in three ways as it applies to a context. I can explain why order matters when writing a ratio in terms of the context. I can use ratio language to describe the relationship between two quantities. 6.RP.A.2 – Understand the concept of a unit rate a/b associated with a ratio a:b with b not equal to 0, and use rate language in the context of a ratio relationship. For example, "This recipe has a ratio of 3 cups of flour to 4 cups of sugar." "We paid $75 for 15 hamburgers, which rate of $5 per hamburger." Learning Target: I can use ratio language to interpret the rate for each unit given the context of a ratio relationship. 6.RP.A.3 – Use ratio and rate reasoning to solve real-world and mathematical problems, e.g., by reasoning about tables of equivalent ratios, tape diagrams, double number line diagrams, or equations. a. Make tables of equivalent ratios relating quantities with whole-number measurements, find missing values in the tables, and plot pairs of values on the coordinate plane. Use tables to compare ratios. Learning Targets: I can create tables of equivalent ratios relating quantities with whole-number measurements given a real-world or mathematical problem. I can find missing values in a table of equivalent ratios relating quantities with whole-number measurements given a real-world or mathematical problem. I can plot pairs of values that represent equivalent ratios on a graph given a real-world or mathematical problem. I can use tables to compare ratios given a real-world or mathematical problem. b. Solve unit rate problems including those involving unit pricing and constant speed. For example, if it took 7 hours to mow 4 lawns, then at that rate, how many lawns could be mowed in 35 hours? At what rate were lawns being mowed? Learning Targets: I can solve real-world problems involving unit pricing using tables of equivalent ratios, tape diagrams, double number line diagrams, or equations. I can solve real-world problems involving constant speed using tables of equivalent ratios, tape diagrams, double number line diagrams, or equations. c. Find a percent of a quantity as a rate per 100 (e.g., 30% of a quantity means times the quantity); solve problems involving finding the whole, given a part and the percent. Learning Targets: I can find a percent of a number as a rate per 100 given a real-world or mathematical problem. I can find the whole given a part and a percent in a real-world or mathematical problem. d. Use ratio reasoning to convert measurement units; manipulate and transform units appropriately when multiplying or dividing quantities. Learning Targets: I can apply ratio reasoning to convert measurement units in real-world and mathematical problems. I can manipulate units appropriately when solving problems using multiplication or division quantities. I can transform units appropriately when solving problems using multiplication or division quantities. Ratio and Rate Help What's a Ratio? A ratio expresses the relationship between 2 related amounts. For instance, in a recipe, the amount of each ingredient that you add is related to the amounts of the other ingredients used. If you're making bread that has 2 cups of flour and 1 cup of water, you could write this as the ratio 2:1 (2 to 1). This information is helpful if you wanted to double the recipe because you'd know that if you doubled the flour to 4 cups, you'd also need to double the water to 2 cups. Ratios are used in lots of other situations as well. For example, imagine that you're given a picture containing 2 triangles and 7 circles, and asked to write the ratio of triangles to circles. You'd simply count the number of each type of shape and write the ratio, which is 2:7. If you'd been asked to write the ratio of circles to triangles instead, it would be 7:2. It's important to note that ratios can also be written as fractions. For instance, 2:7 would be 2/7 and 7:2 would be 7/2. You'll see why this is critical in the next section. Understanding Unit Rates You can think of a unit rate as yet another way of expressing a ratio. To calculate a unit rate, write the ratio as a fraction, and then divide the top number by the bottom number. This will tell you how many of the units on top there are for each bottom unit. Let's use an example to make this a bit more concrete. Going back to the triangles and circles, recall that we said the ratio of triangles to circles was 2:7 or 2/7. To find the unit rate, solve 2 ÷ 7 to get a decimal that rounds to 0.3. This means there are about 0.3 triangles for every 1 circle. You can also reverse this by stating the unit rate in terms of the ratio of circles to squares (7:2 or 7/2). Since 7 ÷ 2 = 3.5, you can also say there are 3.5 circles for every 1 triangle. Unit rates are commonly used for situations that involve rates of speed. For instance, let's say you can ride your bike 20 miles every 2 hours, which can be represented by the ratio 20:2. To find the unit rate of speed in miles per hour (mph), write the ratio as a fraction and divide: 20/2 = 20 ÷ 2 = 10. This means that you're riding your bike at a speed of 10 mph if you cover 20 miles every 2 hours. In lieu of the lip sync contest, the 6th graders were allowed to finish their Reward Day with their favorite game. Don’t be left out!
There are many activities going on this week! Monday: Review Centers and Party Note **Students in Group B will work in groups reviewing the standards that will be tested on Tuesday. **Your student will bring home a note listing what he/she would like to bring for our class party on Friday. (party details below). Tuesday: Group B Math Test **Students will take Unit 3 Statistics Test. (see previous posts for review materials) Wednesday: Latin America Test **Students will be tested on standards: G2, H1, H2, E1, E2, E3 (see previous posts for review materials) **Those students who did not pass the standards from the first Latin America test (Map and culture questions) will also retest on those standards. Thursday: Middle School Reward Day **Bowling in the AM **Bring your favorite board game to share for the afternoon! Friday: Half Day and Party Day **Yahtzee tournament from 8:30 – 10:00 **Class Party from 10:00 – 11:00 Please remember you are welcome to attend the party! **Dismissal at 11:30 am I encourage everyone to go back to previous blogs to review material. Below are some PPTs that I did not use in class that review some of the concepts that will be tested next week!
Our final week in Latin America finds the students exploring the Aztecs and Incas, the Columbian Exchange, and the Atlantic slave trade. The test on this unit will be Wednesday, December 18th. A study guide will go home this week. We will go over the answers on Monday. SS6H1 The student will describe the impact of European contact on Latin America. a. Describe the encounter and consequences of the conflict between the Spanish and the Aztecs and Incas and the roles of Cortes, Montezuma, Pizarro, and Atahualpa. Students should explain the encounter between Montezuma/Aztecs and Cortes/ Spanish conquistadors. Students should be able to explain/describe/discuss/evaluate… * The consequences of the conflict. * The role Montezuma and Cortes played in this encounter. * The encounter between Atahualpa/Incas and Pizarro/Spanish conquistadors. * The consequences of the conflict. * The role Atahualpa and Pizarro played in this encounter. * Extension questions- How did a small band of conquistadors defeat such large and well established empires? What impact did diseases brought over by the Spaniards have on the Aztecs and Incas? b. Explain the impact of the Columbian Exchange on Latin America and Europe in terms of the decline of the indigenous population, agricultural change, and the introduction of the horse. Students should explain the Columbian Exchange and the impact it had on Latin America and Europe. Students do not need to memorize that the beans, potatoes, squash, and maize were transported from the New World to the Old and that sugar, wheat, bananas, and rice were transferred from the Old World to the New World. Instead, students need to focus on the impact the Columbian Exchange had on the decline of the indigenous population (smallpox, measles, influenza brought by Europeans) and why these diseases had such a devastating impact (no immunity). What was the impact of the agricultural change on Latin America and Europe (such as increase in food production and human populations)? What was the impact of the introduction of the horse to the Americas? Extension question- What role did the horse play in the initial encounter between Montezuma/Aztecs and Cortes/Spaniards? SS6H2 The student will explain the development of Latin America and the Caribbean from European colonies to independent nations. a. Describe the influence of African slavery on the development of the Americas. Students should have a basic knowledge of the history behind slavery in the Americas. Students should be able to explain/describe/discuss/evaluate… * triangular trade and its impact. * What happened to the population of indigenous people in the Americas, at the hands of Europeans, which brought about African slavery in Latin America and the Caribbean? * Why were African slaves brought to the Americas? * Describe the influence of African slavery on the economic and cultural development of the Americas. * How did the injustice of slavery lead to the revolutionary uprisings for freedom in Latin America? Here is the PPT we will use this week. Students will have homework Tuesday through Thursday, reading and responding about these historic topics.
This is our last week focusing on statistics, with the Unit 3 test next Tuesday, December 17. In the previous three lessons, students learned about the range and interquartile range. Through these lessons, students built an understanding of maximum, minimum, Q1 and Q3. Throughout the unit students have also been learning about the median. These are the five components of the five-number summary that is required to create a box plot. Furthermore, in the previous lesson, students learned how to create and analyze box plots. On Tuesday, students will compare numerical data using box plots. Going forward, students will build on their usage of graphs to compare data through the use of histograms. Vocabulary: Box Plot: A graph that uses a rectangle to represent the middle 50% of a set of data and “whiskers” at both ends to represent the remainder of the data. Five-Number Summary: Minimum Lower Quartile (Q1) Median Upper Quartile (Q3) Maximum After we finish comparing box plots, we will get MAD on Wednesday! That is, we will calculate the Median Absolute Deviation! Students have used the interquartile range which describes the variability of a set. Another way to describe the variability of a set is to use its mean absolute deviation. The mean absolute deviation of a set is the average distance between each data value and the mean. To find the MAD: 1. Find the mean of the data. 2. What is the distance between each data value and the mean. That is, find the absolute value of the difference between each data value and the mean. 3. Find the average of those differences. We will watch this short instructional video: http://learnzillion.com/lessons/539-summarize-the-spread-of-data-using-range-and-mean-absolute-deviation and then work some problems in class. On Thursday, we will explore another way to record data - the STEM AND LEAF PLOT. We will watch a video... http://www.mathplayground.com/howto_stemleaf.html (7:02) In a stem-and-leaf plot, the data is organized from least to greatest. The digits of the least place value usually form the leaves, and the next place-value digits form the stems. A special table where each data value is split into a "leaf" (usually the last digit) and a "stem" (the other digits). Like in this example: "32" is split into "3" (stem) and "2" (leaf). The "stem" values are listed down, and the "leaf" values go right (or left) from the stem values. The "stem" is used to group the scores and each "leaf" indicates the individual scores within each group. On Friday, my daughter graduates from UGA! This proud mama will be there as another product of Douglas County Schools receives her degree. The substitute will work through HISTOGRAMS with the students. Below is an information sheet explaining the differences between bar graphs and histograms. A HISTOGRAM displays data from a frequency table. A histogram has one bar for each interval. The length of a bar indicates the frequency of the interval. There is no space between bars because there are no gaps between intervals. Because the intervals of a histogram have equal size, the bars have equal width.Through all of the lessons this week, we will bring all of our learning together. Students should be developing a firm understanding of statistical questions, measures of center and spread, and how to create numerous graphs. This is perhaps the ultimate goal in any statistical study: the ability to take a real life data set, and determine what it is telling you based on the shape of the data set, and the context it was collected. The students will hold this lesson with them for the rest of their lives, whether it be something as simple as video game statistics, all the way to understanding newspaper articles and statistics that they come across in all aspects of life. Lesson Vocabulary: Measure of center: A measure of center is one single number that represents the entire data set as a whole. Nominal: A nominal data set includes elements that cannot be put in order. Ordinal: An ordinal data set includes elements that can be put in numerical order.
That is the question that was asked to the Advanced Math Class to gather data to design a box plot. From the data, students came up with their 5-finger summary (minimum, maximum, Q1, Q3, and the median). Some of the results are posted outside our room! To begin the activity, we lined ourselves up from the fewest hours to the most... 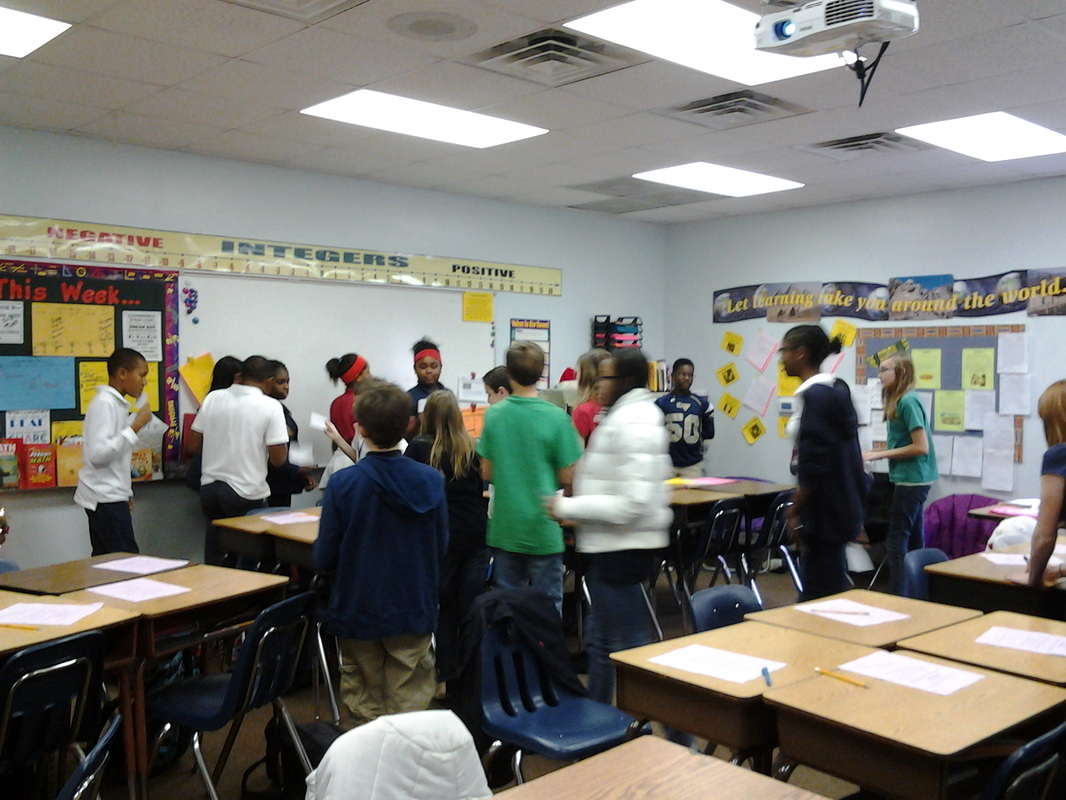
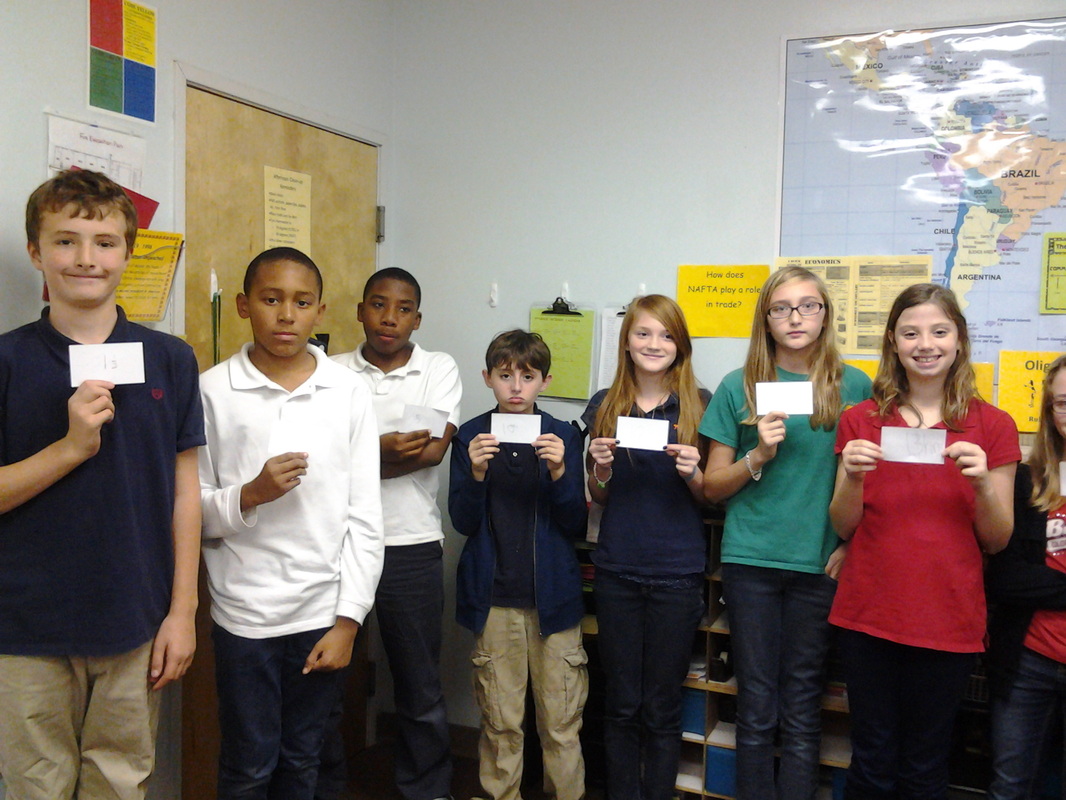
The beginning of our data line...starting at 1 hour...
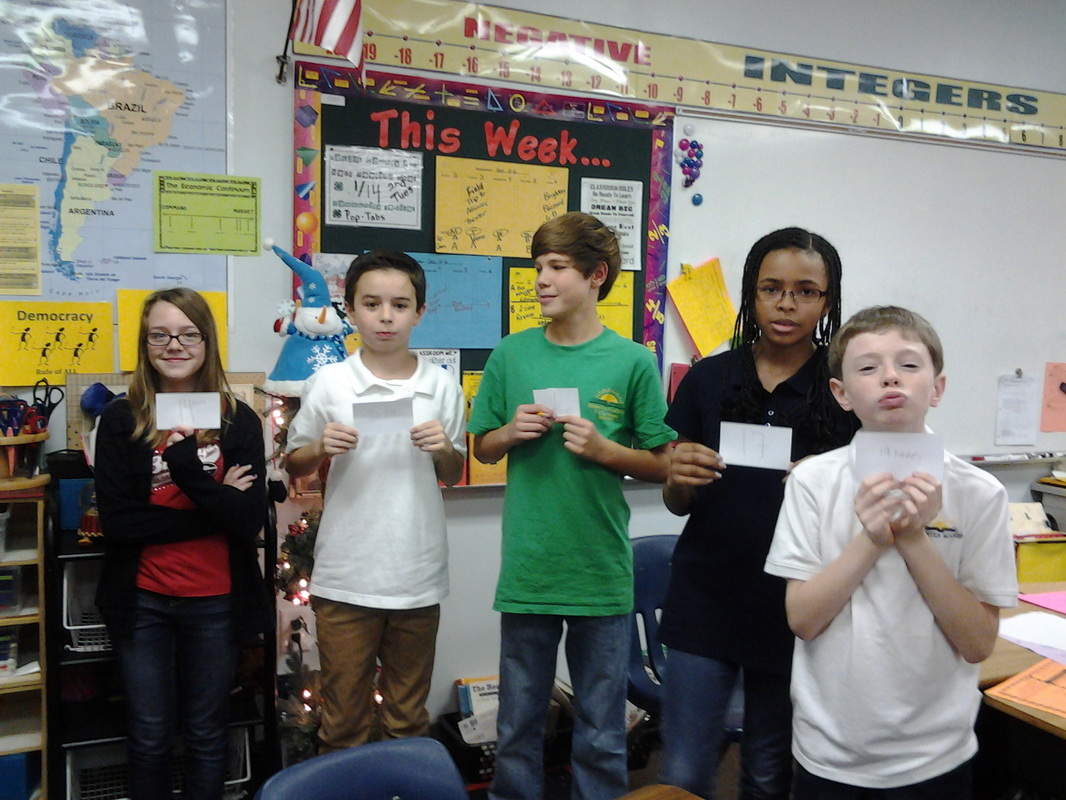
Our amount of hours on technology in one week is increasing....from 14 to 19...
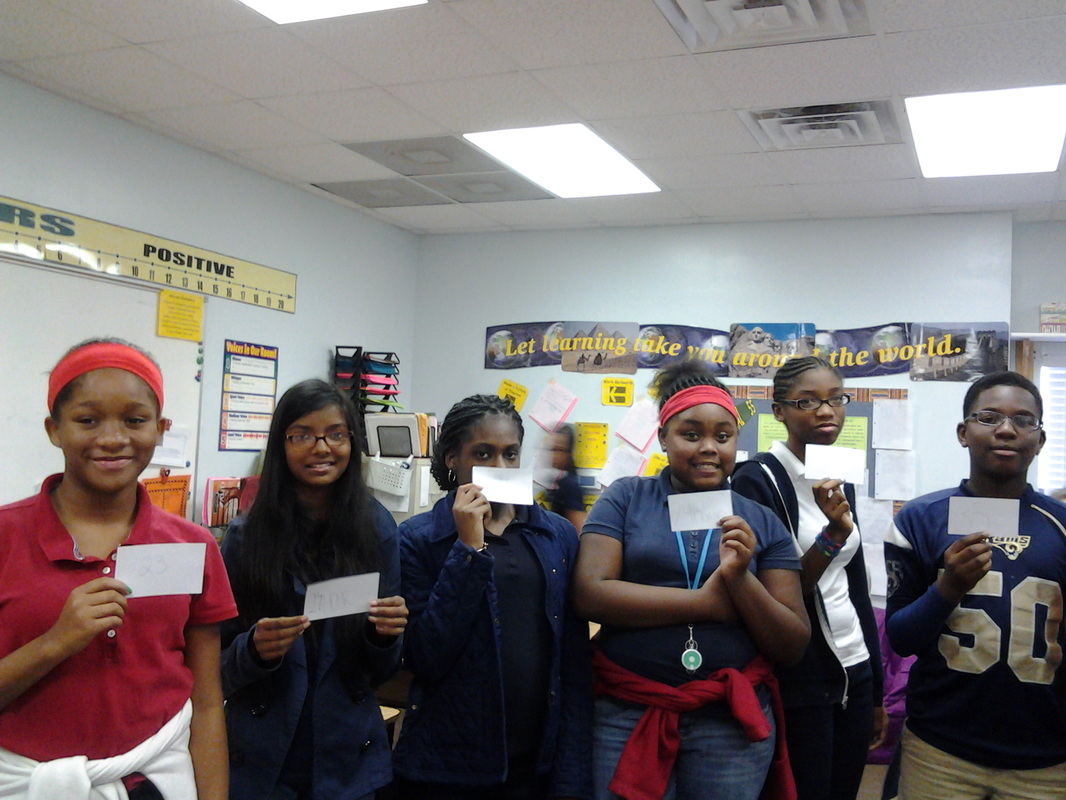
It starts getting higher and higher....23 hours to 35 hours here...
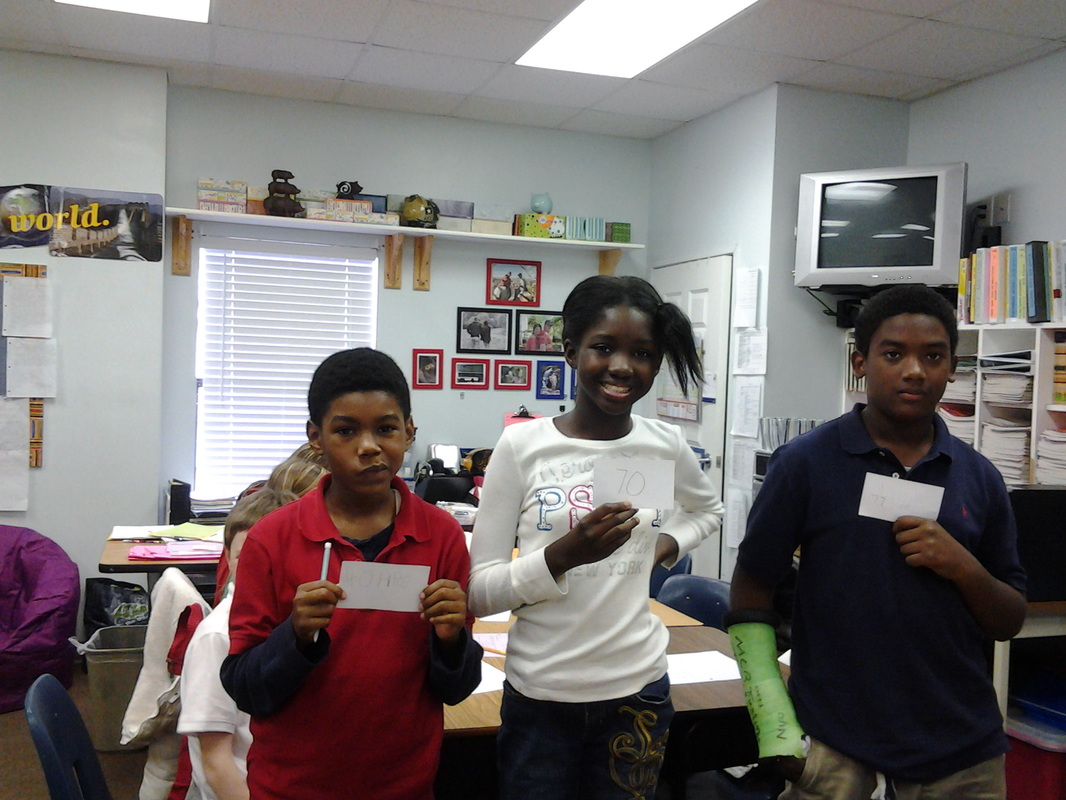
The end of our data....hmmm 40, 70 and 77 hours....
To activate today's lesson, each student was given a strip of paper with one of 13 ideas on it. Then for 8 minutes, students "mingled"...
The strips are attached below so you can review these concepts at home.
|
Mrs. Beck's Math and Social Studies ClassesCategoriesArchives
April 2015
Categories |
||||||||||||||||||||
 RSS Feed
